
Telling Stories with Data
...with some assistance from Python
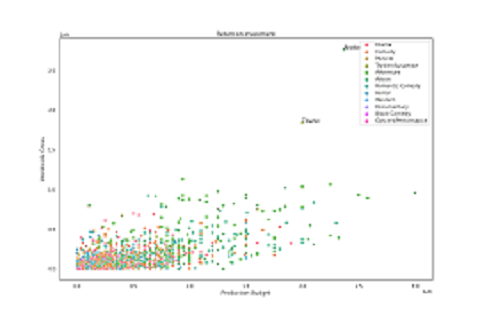
Visualizations are often used to convey alot of information in a single image. Data is used to tell a story about a particular subject. In many cases these visualizations guide the viewer to form certain conclusions about a situation, what causes certain outcomes and what information may not be meaningful.
The visualizations were constructed using Python developed in Jupyter/Colab notebooks. Most of the notebooks can be found in my GitHub repo.
Important libraries used for these visualizations include Matplotlib, Seaborn, Pandas, Altair and others. Online databases used include Kaggle, Vega_Data and Google Data.
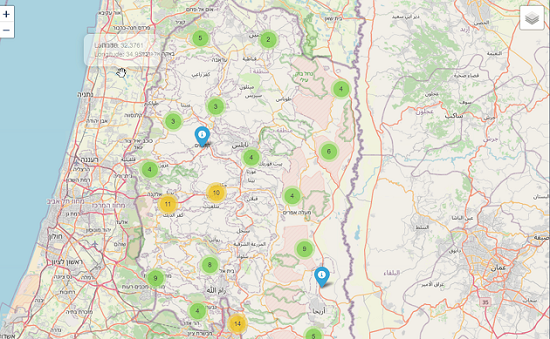
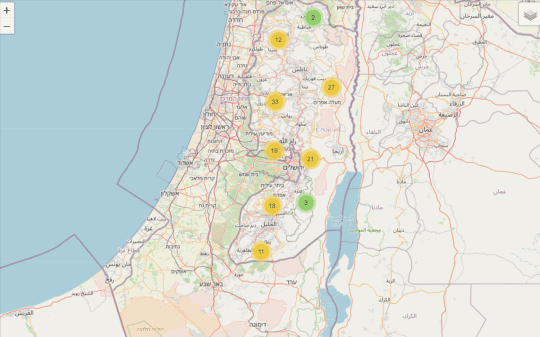
Israel Settlements Clustering & GPS Positioning -
Interactive
The 2 maps below show settlement visualizations using clustering to prevent display over crowding. Users can see individual settlements by clicking on the cluster icons, view their GPS coordinates and see the settlement's history via popup windows.
To view visualizations, place mouse pointer over the map for animation. JavaScript is used to enable the rollover effect.
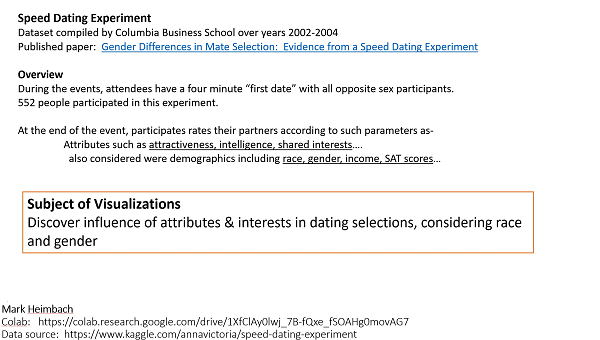
Dating Analysis - Speed Dating (Columbia Business School 2002-2004)
Overview
Attendees had a four minute "first date" will all opposite sex participants. Approximately 1000 people participated. At the end of the event, participants rated their partners according to attractiveness, intelligence, shared interests and other parameters. Race, gender, income were considered in the analysis. A presentation is shown below which illustrates how interests intersect. Data Source: https://www.kaggle.com/annavictoria/speed-dating-experiment
 |
||||||||
|---|---|---|---|---|---|---|---|---|